To totally unlock this section you need to Log-in
Login
In many ways "data handling" is just a new name for "statistics". The term data handling with its clear emphasis on activity is a practical subject devoted to the obtaining and processing of data with a view to making statements, called inferences, which often extend beyond the data.
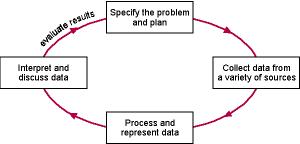
The handling data cycle
This is closely linked to the mathematical key processes and consists of:
- specifing the problem and planning (Representation)
- collecting data (Representing and Planning)
- processing and presenting the data (Analysing)
- interpreting and discussing the results (Interpreting and Evaluating)
The first stage is to decide on the enquiry and the questions to investigate. Planning needs to determine what data to collect and how to do this.
Data is collected either from primary (first-hand) sources, perhaps by carrying out a survey or experiment, or from secondary sources such as reference books or the Internet.
The data is then organised and represented in the most appropriate graph, chart or table.
The final stage is to interpret and discuss the data in order to find answers to the original questions.
It may be helpful to follow Alan Graham, author of Investigating Statistics, and use the acronym PCAI to spell out the four main stages of data-handling.
P - Posing the question
This must be done in such a way that you can see what needs to be observed, measured or counted to give an insight towards an answer. Usually the first question tends to be too general and needs to be made more specific.
C - Collecting the data
The pupils measured how long it took children to decide whether it would be safe to cross, how long it took the vehicle to travel from the corner when it first came into sight to where they were standing, and how long it took pupils to cross the road. To collect the data they had to design a data collection sheet (spreadsheet).
A - Analysing the data
This will include calculations and graphical and pictorial representation. It should be remembered that graphs can have two purposes - to explore the data (analysis) and to display the data (reporting). The analysis is done using frequency tables, bar charts, pie charts and simple calculations.
As you may have already guessed from the way the data have been presented, they were entered into a spreadsheet. Typically are calculated eight relevant summary statistics (Mean, Range, IQR, Minimum, Q1, Q3, Maximum and Median).
Producing these summaries is an important step in this step of an investigation and can be greatly supported by ICT. Information and Communication Technology can also support creating helpful visual representations of the data (graphs, charts, reports, etc.).
I -Interpreting the results
This stage can be summarized by using the following question: "What insight into the original question do the results give?"
 |  |